
The Middle Cedar Watershed
Management Plan
In October of 2017, the Middle Cedar Watershed Management Authority selected Emmons & Olivier Resources, Inc. (EOR) to lead a watershed-wide planning effort. Over the course of the two year planning process, EOR developed a comprehensive watershed management plan that lays out a 20 year road map prioritizing conservation efforts across the Middle Cedar Watershed. This plan includes information from public input sessions for both urban and rural residents, technical assessments, and hazard mitigation assessments.


Subwatershed Plans
The Middle Cedar Watershed Management Plan includes additional focused planning of five HUC-12 subwatersheds and two case studies. These plans provide a closer look at some of the detailed aspects of smaller watersheds and communities and their impacts and opportunities.


The Agricultural Conservation Planning Framework (ACPF) is a spatial analysis tool that assists agricultural conservation planning across a broad region at watershed and field scales using soils, land use, and terrain data. This tool is being used in the Middle Cedar Watershed to characterize the landscape and identify conservation practices that, once implemented, will meet the Iowa Nutrient Reduction Strategy’s goals. The conceptual basis for the ACPF is the Conservation Pyramid Framework, which emphasizes soil health management and the effective use of multiple practices to meet water quality goals.
The Conservation Pyramid Framework emphasizes soil conservation as the foundation for agricultural watershed management. This approach is aimed at improving soil health within cropped fields to avoid and control nutrient losses by:
-
Protecting soils from erosion with zero or minimum tillage
-
Limiting excess nutrients through rates and timing of fertilizer and manure applications
-
Building soil organic matter and rejuvenation of compacted soils with intensified crop rotations
The upper-tiered sections of the pyramid speak to the successive importance of first treating water runoff within fields (place water detention/nutrient removal practices). And finally, within the creek or stream (place/design practices for ecosystem and nutrient removal).
Radio Interview
What the HUC are you talking about?

Table 1: USGS Watershed Hierarchical System
The United States Geological Survey (USGS) created a hierarchical system of watershed areas represented by a unique Hydrologic Unit Code (HUC) number. There are six levels in the hierarchy, represented by hydrologic unit codes from 2 to 12 digits long, called regions, subregions, basins, subbasins, watersheds, and subwatersheds. In this system, the Middle Cedar is actually referred to as a Subbasin. Table 1 below describes the USGS system’s hydrologic unit levels and their characteristics, along with example names and codes from the Middle Cedar. An illustration of the USGS HUC code system using the Middle Cedar example is shown in Table 1.

Figure 1:
Illustration of USGS Hydrologic Unit Code Hierarchy
The Middle Cedar includes eight HUC-12 subwatersheds within fifteen HUC-10 watersheds. Subwatersheds are the smallest unit within the USGS system although many times, these are further subdivided for a variety of purposes, particularly in the construction of hydrologic and water quality models. Subwatersheds are the hydrologic-scale that is commonly used for implementation efforts. At this scale, landowners are likely to have personal relationships, and a small, dedicated group can have a meaningful role in improving the health of a subwatershed. Reious watershed management planning in the Middle Cedar has occurred at the Subwatershed, or HUC-12 scale, although
Note that there are three HUC-10 watersheds associated with Beaver and Black Hawk Creeks, which leads to some confusion as these areas are commonly referred to as ‘watersheds’. These areas are the equivalent of a HUC-9, although that level does not formally exist within the USGS system. Currently, a watershed management initiative is being organized for Black Hawk Creek, with encompasses ten HUC-12 subwatersheds within three HUC-10 watersheds. some of these efforts have involved multiple HUC-12s (Table 2).
Soil Erosion in the Middle Cedar
The Daily Erosion Project (DEP) is a free online tool that allows users to understand how fast soil is being lost off the land. The tool arms farmers and conservation planner with the information needed to make effective decisions regarding resources. The tool takes precipitation data provided by the Next Generation Weather Radar (NEXRAD) and estimates the amount of soil erosion taking place on the land based on soil type, vegetative cover and slope on a daily basis. The tool also estimates the amount of eroded soil that is delivered to downstream waters using the Water Erosion Prediction Project (WEPP) Model. Further documentation of the Daily Erosion Project can be found on the project website.
DEP users can either view data for a single day or choose to enter a specific date range of interest. Data can be viewed for the entire State of Iowa (and beyond) or at the very local HUC-12 subwatershed scale. An example of the DEP output for a single day is shown in Figure 1.

Figure 1: Example Output from the Daily Erosion Project DEP Website.

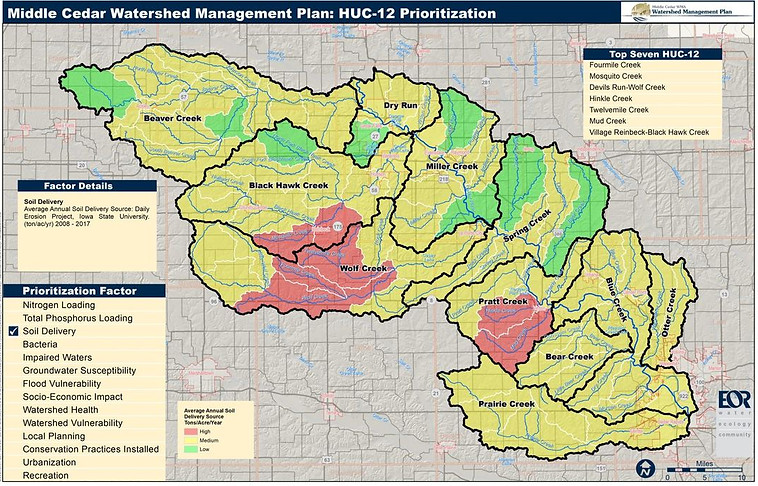
Figure 1: Example Output from the Daily Erosion Project DEP Website.